

- 01 Occurrence of reverse run incident
- 02 Occurrence of reverse run accident
- 03 Reverse running incidents by motive
Source: Handout from the 8th Expert Committee on Measures to Prevent Wrong-Way Driving on Expressway
01 Occurrence of reverse run incident
- nationwide Expressway In reverse, reverse run occurs approximately once every two days
- 41% of wrong-way driving incidents occur at junctions and entrances/exits
- 68% of wrong-way drivers were 65 years old or older, and 49% of them were 75 years old or older.
<Trends and locations of reverse run incidents>
* Occurrence point is classified by reverse run start point
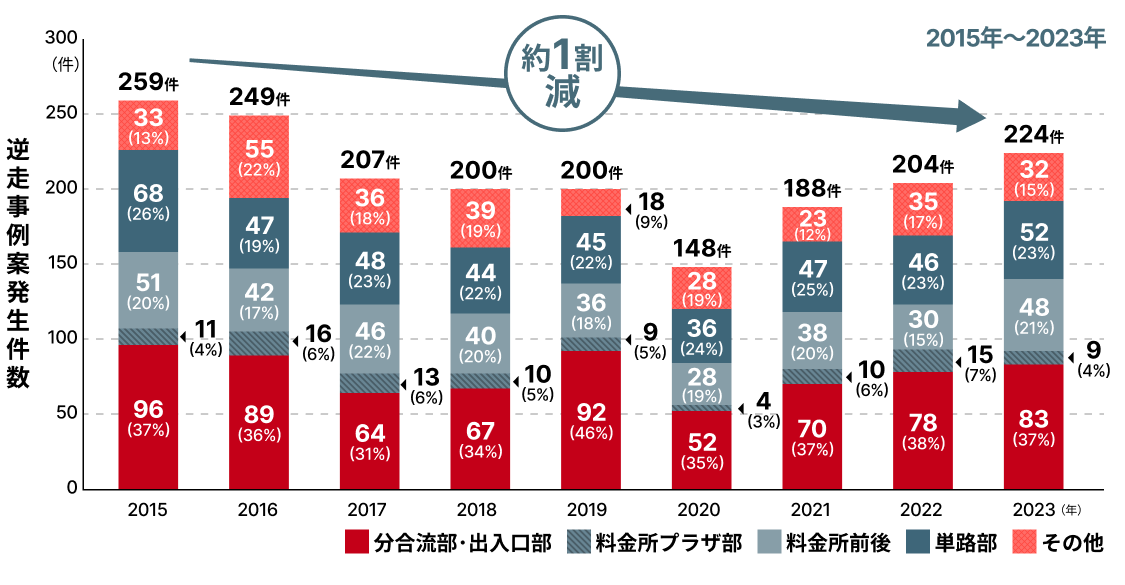
Number of wrong-way driving incidents
| 2015 | 96 cases (37%) at junctions and entrances, 11 cases (4%) at toll plazas, 51 cases (20%) before and after toll gates, 68 cases (26%) on single-lane roads, 33 cases (13%) elsewhere, totaling 259 cases |
|---|---|
| 2016 | 89 cases (36%) at intersections and entrances, 16 cases (6%) at toll plazas, 42 cases (17%) before and after toll gates, 47 cases (19%) on single-lane roads, 55 cases (22%) elsewhere, totaling 249 cases |
| 2017 | 64 cases (31%) at junctions and entrances, 13 cases (6%) at toll plazas, 46 cases (22%) before and after toll gates, 48 cases (23%) on single-lane roads, 36 cases (18%) elsewhere, totaling 207 cases |
| 2018 | 67 cases (34%) at junctions and entrances, 10 cases (5%) at toll plazas, 40 cases (20%) around toll gates, 44 cases (22%) on single-lane roads, 39 cases (19%) elsewhere, totaling 200 cases |
| 2019 | 92 cases (46%) at junctions and entrances, 9 cases (5%) at toll plazas, 36 cases (18%) before and after toll gates, 45 cases (22%) on single-lane roads, 18 cases (9%) elsewhere, totaling 200 cases |
| 2020 | 52 cases (35%) at junctions and entrances, 4 cases (3%) at toll plazas, 28 cases (19%) before and after toll gates, 36 cases (24%) on single-lane roads, 28 cases (19%) elsewhere, totaling 148 cases |
| 2021 | 70 cases (37%) at junctions and entrances, 10 cases (6%) at toll plazas, 38 cases (20%) before and after toll gates, 47 cases (25%) on single-lane roads, 23 cases (12%) elsewhere, totaling 188 cases |
| 2022 | 78 cases (38%) at junctions and entrances, 15 cases (7%) at toll plazas, 30 cases (15%) around toll gates, 46 cases (23%) on single-lane roads, 35 cases (17%) elsewhere, totaling 204 cases |
| 2023 | 83 cases (37%) at junctions and entrances, 9 cases (4%) at toll plazas, 48 cases (21%) before and after toll gates, 52 cases (23%) on single-lane roads, 32 cases (15%) elsewhere, totaling 224 cases |
| 2024 | 91 cases (41%) at intersections and entrances, 17 cases (8%) at toll plazas, 53 cases (24%) around toll gates, 36 cases (16%) on single-lane roads, 23 cases (11%) elsewhere, totaling 220 cases |
<Age of the wrong-way driver in 2024>
January 2024 to December 2024 (total of 220 cases)
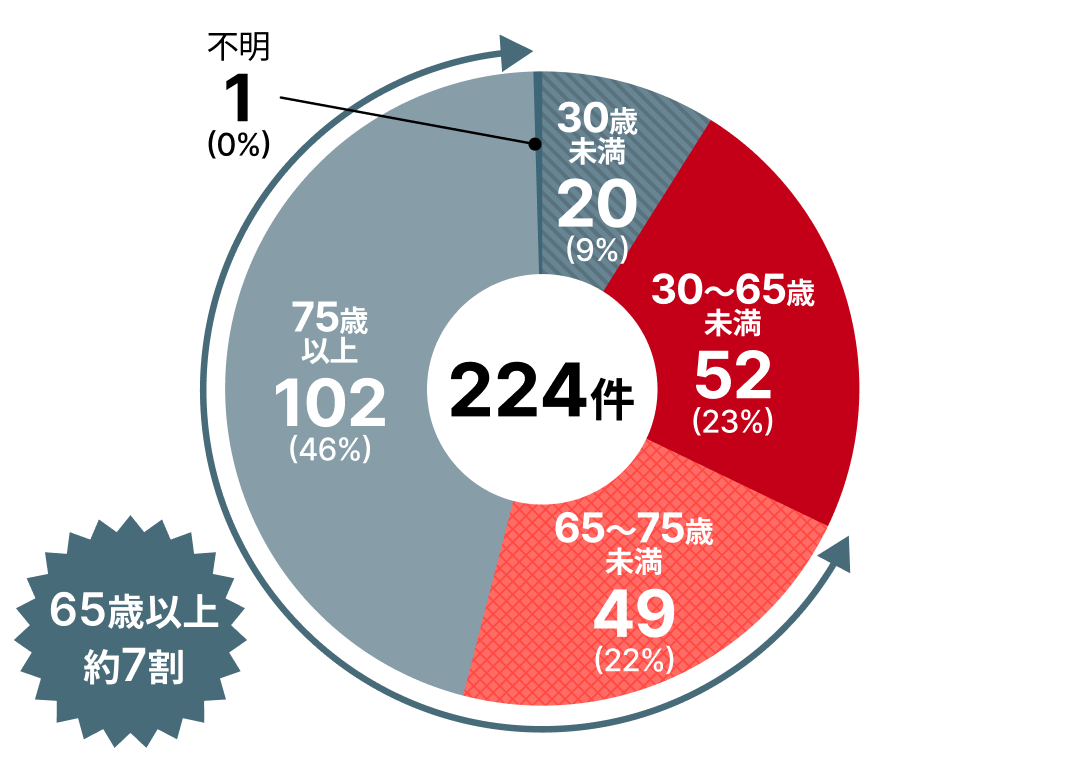
Approximately 70% of wrong-way drivers in 2024 will be 65 or older.
Under 30 years old: 14 cases (6%)
50 cases (23%) between the ages of 30 and 65
41 cases (19%) between 65 and 75 years old
109 cases (49%) aged 75 or older
Unknown 6 cases (3%)
Total 220 items
Data: Cases of wrong-way driving resulting in accidents or seizures on Expressway (managed by Ministry of Land, Infrastructure, Transport and Tourism and Expressway companies) from 2015 to 2024 N = 2,099
Source: Prepared by Ministry of Land, Infrastructure, Transport and Tourism, Transport Expressway Companies with the cooperation of the police
02 Occurrence of reverse run accident
- Of the cases of wrong-way driving, there are around 40 wrong-way driving accidents each year, and in 2024 there will be 50, a slight increase from the previous year.
- Wrong-way driving accidents are about 38 times more likely to result in a fatality than all other accidents on Expressway, and about four times more likely to result in a fatality or injury.
<Changes in the number of reverse-running accidents and types of accidents>
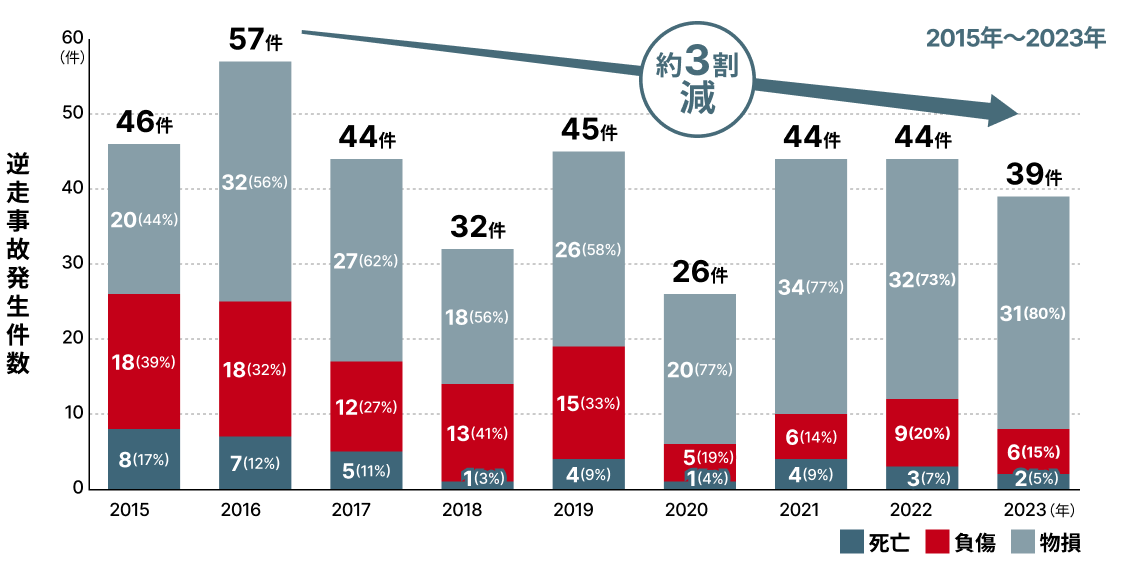
Number of reverse run accidents
| 2015 | 8 fatalities (17%), 18 injuries (39%), 20 property damages (44%) |
|---|---|
| 2016 | 7 fatalities (12%), 18 injuries (32%), 32 property damages (56%) |
| 2017 | 5 fatalities (11%), 12 injuries (27%), 27 property damages (62%) |
| 2018 | 1 fatality (3%), 13 injuries (41%), 18 property damages (56%) |
| 2019 | 4 fatalities (9%), 15 injuries (33%), 26 property damages (58%) |
| 2020 | 1 fatality (4%), 5 injuries (19%), 20 property damages (77%) |
|---|---|
| 2021 | 4 fatalities (9%), 6 injuries (14%), 34 property damages (77%) |
| 2022 | 3 fatalities (7%), 9 injuries (20%), 32 property damages (73%) |
| 2023 | 2 fatalities (5%), 6 injuries (15%), 31 property damages (80%) |
| 2024 | 4 fatalities (8%), 10 injuries (20%), 36 property damages (72%) |
<Age of wrong-way drivers in 2024>
January 2024 to December 2024 (total of 50 cases)
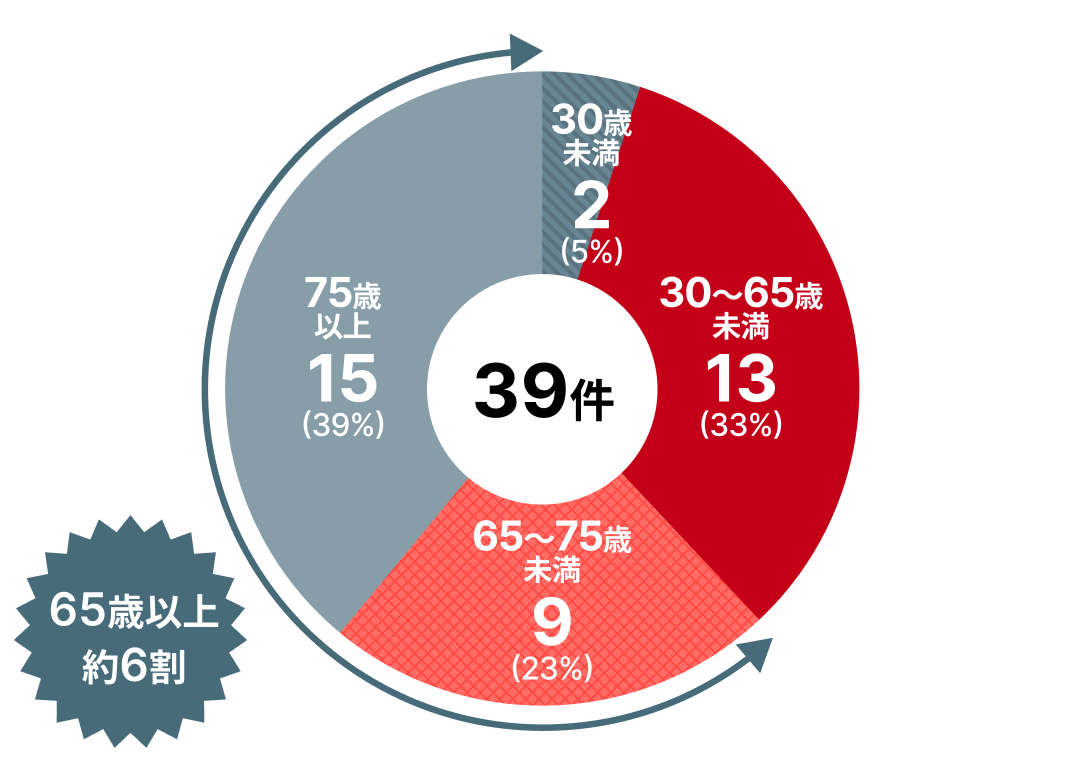
The age distribution of wrong-way driving accidents in 2024 will be approximately 50% for drivers aged 65 or older, of which 34% will be aged 75 or older.
Under 30 years old: 7 cases (14%)
15 cases (30%) between the ages of 30 and 65
7 cases (14%) between the ages of 65 and 75
17 cases (34%) aged 75 or over
Unknown 4 cases (8%)
Total of 50 items
Data: Cases of wrong-way driving resulting in accidents on Expressway (managed by Ministry of Land, Infrastructure, Transport and Tourism and Expressway companies) from 2015 to 2024 N = 427
Source: Prepared by Ministry of Land, Infrastructure, Transport and Tourism, Transport Expressway Companies with the cooperation of the police
Comparison of wrong-way driving accidents and overall Expressway accidents
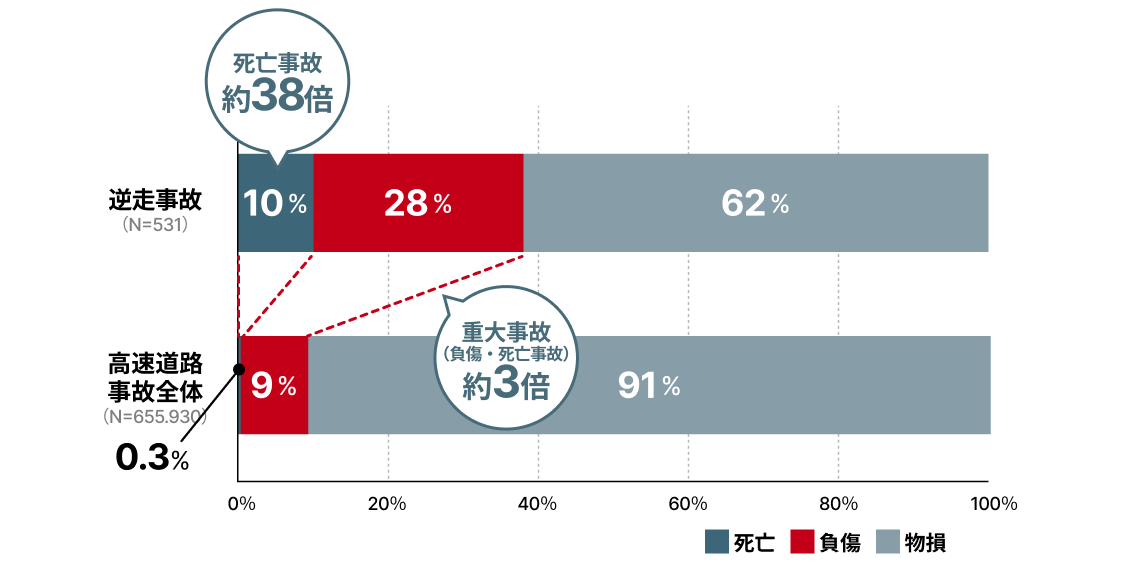
Data: Breakdown of 581 wrong-way driving accidents and 710,828 Expressway accidents from 2011 to 2024
Source: Prepared by Ministry of Land, Infrastructure, Transport and Tourism, Transport Expressway Companies with the cooperation of the police
03 Occurrence of reverse run incidents by motive
- In terms of the number of wrong-way driving cases by motive, data from 2015 to 2023 shows that approximately 20% were intentional, approximately 40% were negligent, and approximately 30% were unaware, with the same trend for 2024.
- In terms of the number of wrong-way driving accidents by motive, data from 2015 to 2023 shows that approximately 20% were intentional, approximately 40% were negligent, and approximately 20% were due to lack of awareness.In 2024, the same trend was seen: approximately 10% were intentional, approximately 40% were negligent, and approximately 10% were due to lack of awareness.
[Definition]
Intentional: A case where a driver started driving in the wrong direction while being aware that they would be driving in the wrong direction
Negligence: A case where a driver started driving in the wrong direction without realizing that the driver was going in the wrong direction.
Lack of awareness: People who are unaware that they were driving the wrong way even when they stopped due to an accident, being caught, etc. (dementia, etc.)
-
- Intentionally driving in the wrong direction to return to the original route
-
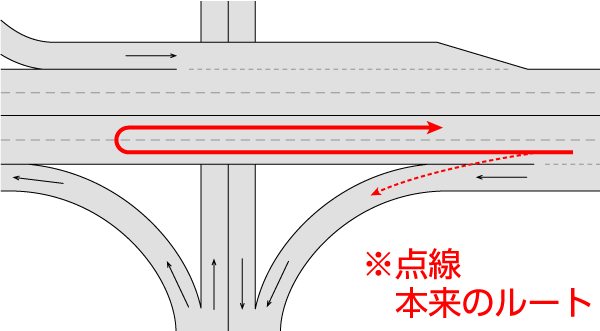
(Example: You pass the intended interchange and then intentionally drive the wrong way to return to the exit ramp you were originally intended to exit from.)
-
- Driving in the wrong direction to return to the original route (negligence)
-
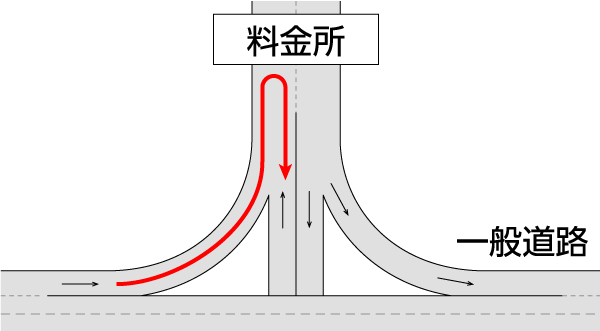
(Example: Realizing that you have entered Expressway by mistake, you turn around just before the toll booth to return to the general road, and then drive the wrong way up the on-ramp to the opposite lane without realizing that you are driving the wrong way.)
-
- I took the wrong route.
Driving the wrong way (negligence) -
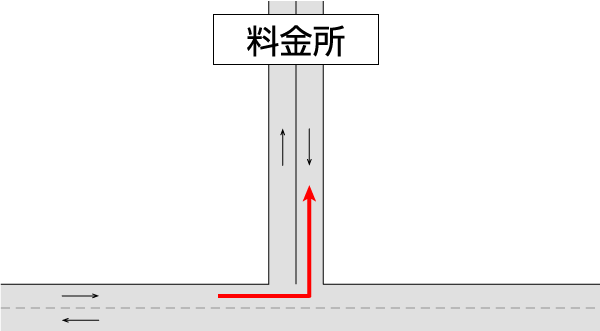
(Example: Entering from a general road at the wrong entrance and taking the wrong exit)
- I took the wrong route.
<Changes in the number of reverse run incidents by motive>
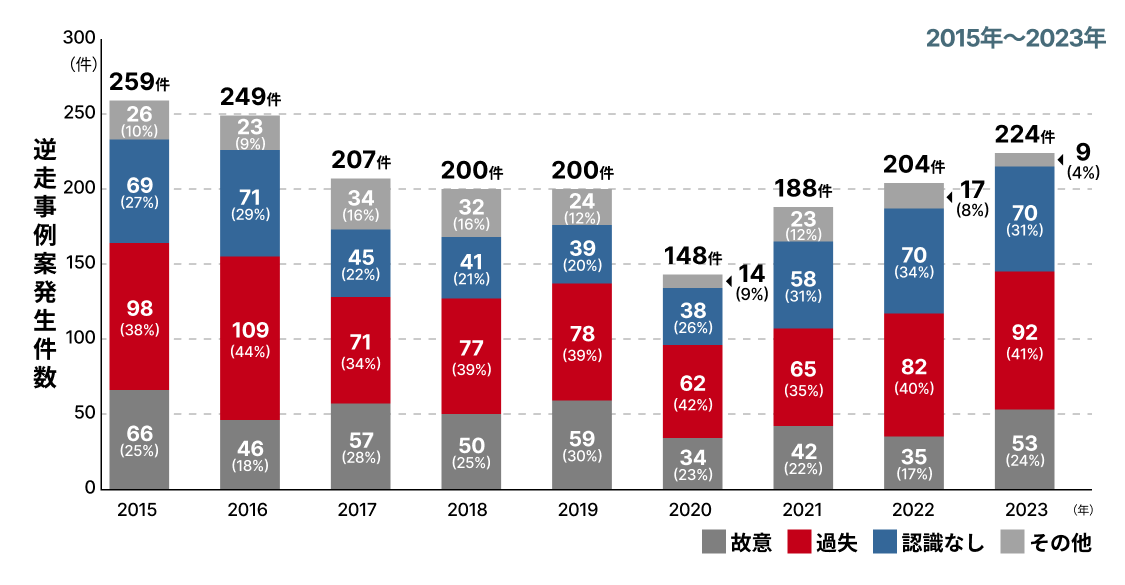
Number of wrong-way driving incidents
| 2015 | Intentional 66 cases (25%), Negligence 98 cases (38%), Unaware 69 cases (27%), Other/Unknown 26 cases (10%), Total 259 cases |
|---|---|
| 2016 | Intentional 46 cases (18%), Negligence 109 cases (44%), Unawareness 71 cases (29%), Other/Unknown 23 cases (9%), Total 249 cases |
| 2017 | Intentional 57 cases (28%), negligence 71 cases (34%), unawareness 45 cases (22%), other/unknown 34 cases (16%), total 207 cases |
| 2018 | Intentional 50 cases (25%), Negligence 77 cases (39%), Unaware 41 cases (21%), Other/Unknown 32 cases (16%), Total 200 cases |
| 2019 | Intentional 59 cases (30%), Negligence 78 cases (39%), Unaware 39 cases (20%), Other/Unknown 24 cases (12%), Total 200 cases |
| 2020 | Intentional 34 cases (23%), Negligence 62 cases (42%), Unawareness 38 cases (26%), Other/Unknown 14 cases (9%), Total 148 cases |
| 2021 | Intentional 42 cases (22%), negligence 65 cases (35%), unawareness 58 cases (31%), other/unknown 23 cases (12%), total 188 cases |
| 2022 | Intentional 35 cases (17%), Negligence 82 cases (40%), Unawareness 70 cases (34%), Other/Unknown 17 cases (8%), Total 204 cases |
| 2023 | Intentional 53 cases (24%), negligence 92 cases (41%), unawareness 70 cases (31%), other/unknown 9 cases (4%), total 224 cases |
| 2024 | Intentional: 44 cases (20%), Negligence: 78 cases (36%), Unawareness: 73 cases (33%), Other/Unknown: 25 cases (11%), Total: 220 cases |
<Changes in the number of wrong-way driving accidents by motive>
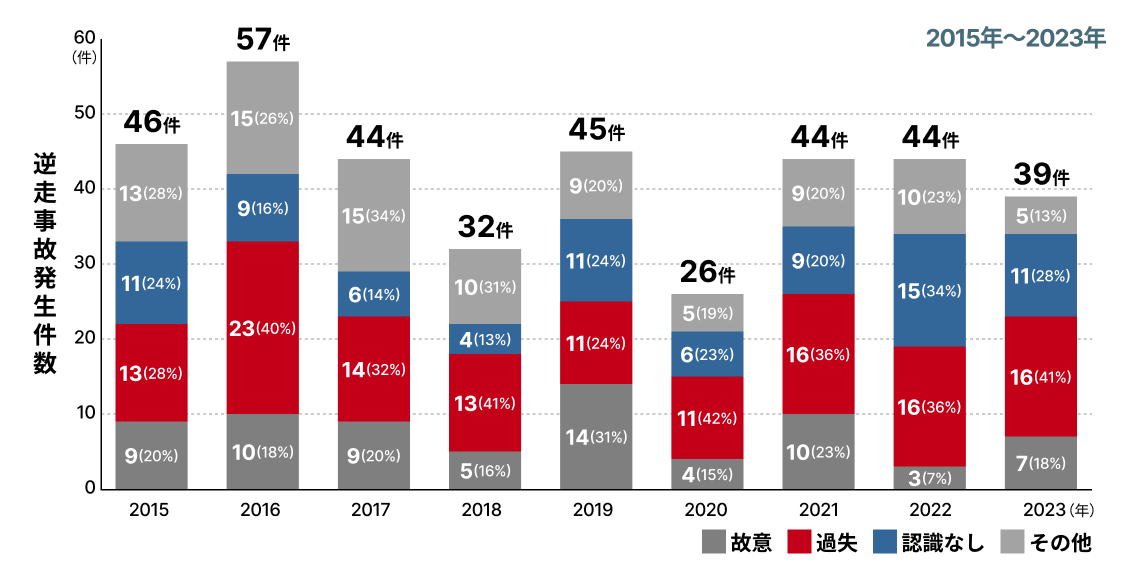
Number of reverse run accidents
| 2015 | Intentional: 9 cases (20%), Negligence: 13 cases (28%), Unawareness: 11 cases (24%), Other/Unknown: 13 cases (28%), Total: 46 cases |
|---|---|
| 2016 | Intentional: 10 cases (18%), Negligence: 23 cases (40%), Unawareness: 9 cases (16%), Other/Unknown: 15 cases (26%), Total: 57 cases |
| 2017 | Intentional: 9 cases (20%), Negligence: 14 cases (32%), Unawareness: 6 cases (14%), Other/Unknown: 15 cases (34%), Total: 44 cases |
| 2018 | Intentional: 5 cases (16%), Negligence: 13 cases (41%), Unawareness: 4 cases (13%), Other/Unknown: 10 cases (31%), Total: 32 cases |
| 2019 | Intentional: 14 cases (31%), Negligence: 11 cases (24%), Unawareness: 11 cases (24%), Other/Unknown: 9 cases (20%), Total: 45 cases |
| 2020 | Intentional: 4 cases (15%), Negligence: 11 cases (42%), Unaware: 6 cases (23%), Other/Unknown: 5 cases (19%), Total: 26 cases |
| 2021 | Intentional 10 cases (23%), Negligence 16 cases (36%), Unaware 9 cases (20%), Other/Unknown 9 cases (20%), Total 44 cases |
| 2022 | Intentional: 3 cases (7%), Negligence: 16 cases (36%), Unawareness: 15 cases (34%), Other/Unknown: 10 cases (23%), Total: 44 cases |
| 2023 | Intentional: 7 cases (18%), Negligence: 16 cases (41%), Unawareness: 11 cases (28%), Other/Unknown: 5 cases (13%), Total: 39 cases |
| 2024 | Intentional: 7 cases (14%), Negligence: 21 cases (42%), Unawareness: 7 cases (14%), Other/Unknown: 15 cases (30%), Total: 50 cases |
Data: Cases of wrong-way driving resulting in accidents or seizures on Expressway (managed by Ministry of Land, Infrastructure, Transport and Tourism and Expressway companies) from 2015 to 2024 N = 2,099
Source: Prepared by Ministry of Land, Infrastructure, Transport and Tourism, Transport Expressway Companies with the cooperation of the police
<Proportion of wrong-way driving incidents by initiating cause in 2024>
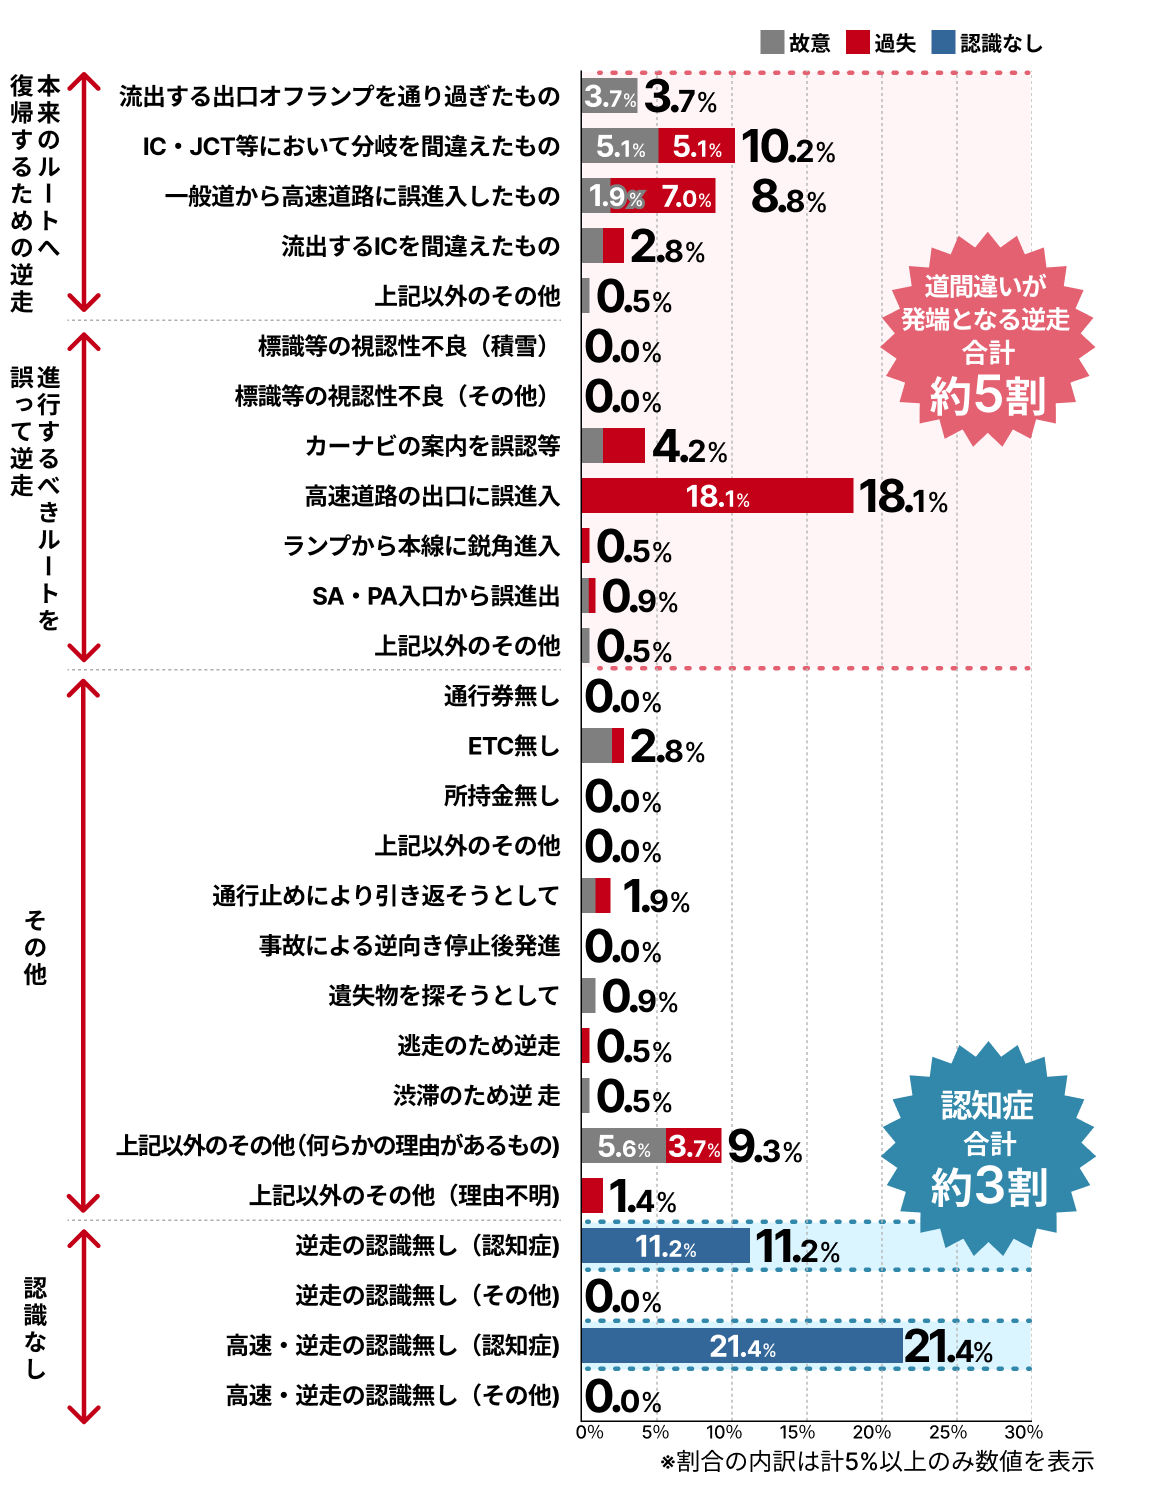
Data: Cases of wrong-way driving resulting in accidents or seizures on Expressway (managed by Ministry of Land, Infrastructure, Transport and Tourism and Expressway companies) in 2024 N=220
Source: Prepared by Ministry of Land, Infrastructure, Transport and Tourism, Transport Expressway Companies with the cooperation of the police
